FeatureGraph: Automating Scientific and Engineering Time-Series Analysis
Turning a time-series signal recording into a deterministic, reusable computational record.
A note on authorship: The views and opinions expressed in this post belong to the authors. Cohere Labs supports open sharing, discussion, and dialogue, and is proud to provide a platform for voices and perspectives from our global community. Learn more about our Open Science initiatives.
The problem we want to solve
Scientific and engineering timeseries data analysis is not standardized, which means researchers carry out a lot of repeated ad hoc coding work and end up with data artifacts that diverge and create multiple sources of truth. FeatureGraph can start to solve the problem by standardizing researcher work and creating a single source of truth for computed and derived analysis.
Here’s a familiar experience for a lot of researchers and data scientists:
Researcher work and ad hoc analysis gets thrown away, forgotten, and carried out again and again. The same people on the same team are writing slightly different code, the same problems are being solved over and over, and boilerplate code gets reused in slightly different forms. Code regularly gets written to be used for one analysis or study and called up again months later, and often the work is saved in a notebook using outdated code on previous versions of the data, broken dependencies, or logic that no longer applies.
Divergent data sources create multiple sources of truth. Teams sometimes try to sidestep the problem of disposable code buried in notebooks by creating reusable centralized code libraries. But disposable code is only part of the issue. The other, far more consequential part is the data artifacts teams create, including not only static files but databases and data services accessible to downstream users. These created artifacts, which all serve as sources of truth, get handed around, diverge from each other, and get recreated with different expectations.
Computations and derivations disagree and are therefore not trusted. A research team within an organization makes its own decisions on computation parameters, and those decisions are often not cross-compared with those of other research groups. When different teams give slightly or even significantly different answers to the same question, there is not always an obvious way to track where the disagreement came from.
The problem is invisible until it isn’t. Timeseries derivations slowly and imperceptibly become less trustworthy the less reproducible they are and the more potential sources of truth exist. A team only becomes aware of the scope of the problem when a study or report expected to take hours to produce ends up taking days or weeks because the “correct” numbers have to be hunted down.
The project
FeatureGraph proposes to build a solution for two aspects of the problem: the repeated construction of derivations from timeseries scientific and engineering data, and how that derived work is accessed. It provides a persistent store both where raw timeseries data is automatically processed and summarized and where the results of previous analysis work are verified, recorded, and immediately available as one source of truth.
Research teams run analyses and derive results the same way every time, using explicit sets of construction assumptions. They query the results of each analysis from one place where its provenance is clearly defined. Provenance, assumptions, and accuracy can be tracked and verified by construction.
By coupling construction and access, assumptions can be changed and a study rerun from the same access point with minimal work. Even studies that genuinely need to be carried out multiple times in slightly different ways are all recorded, stored, and accessed from the same source. An analysis on the same data that needs different smoothing window parameters, sampling intervals, or summary-level filters creates a new defined study, so the difference is visible and recorded.
An additional benefit of using FeatureGraph is the ability to natively automate research tasks with AI agents in constrained workflows, allowing language models to construct and use the same derived studies as human researchers. Ongoing development on this is discussed in later sections.
How it works
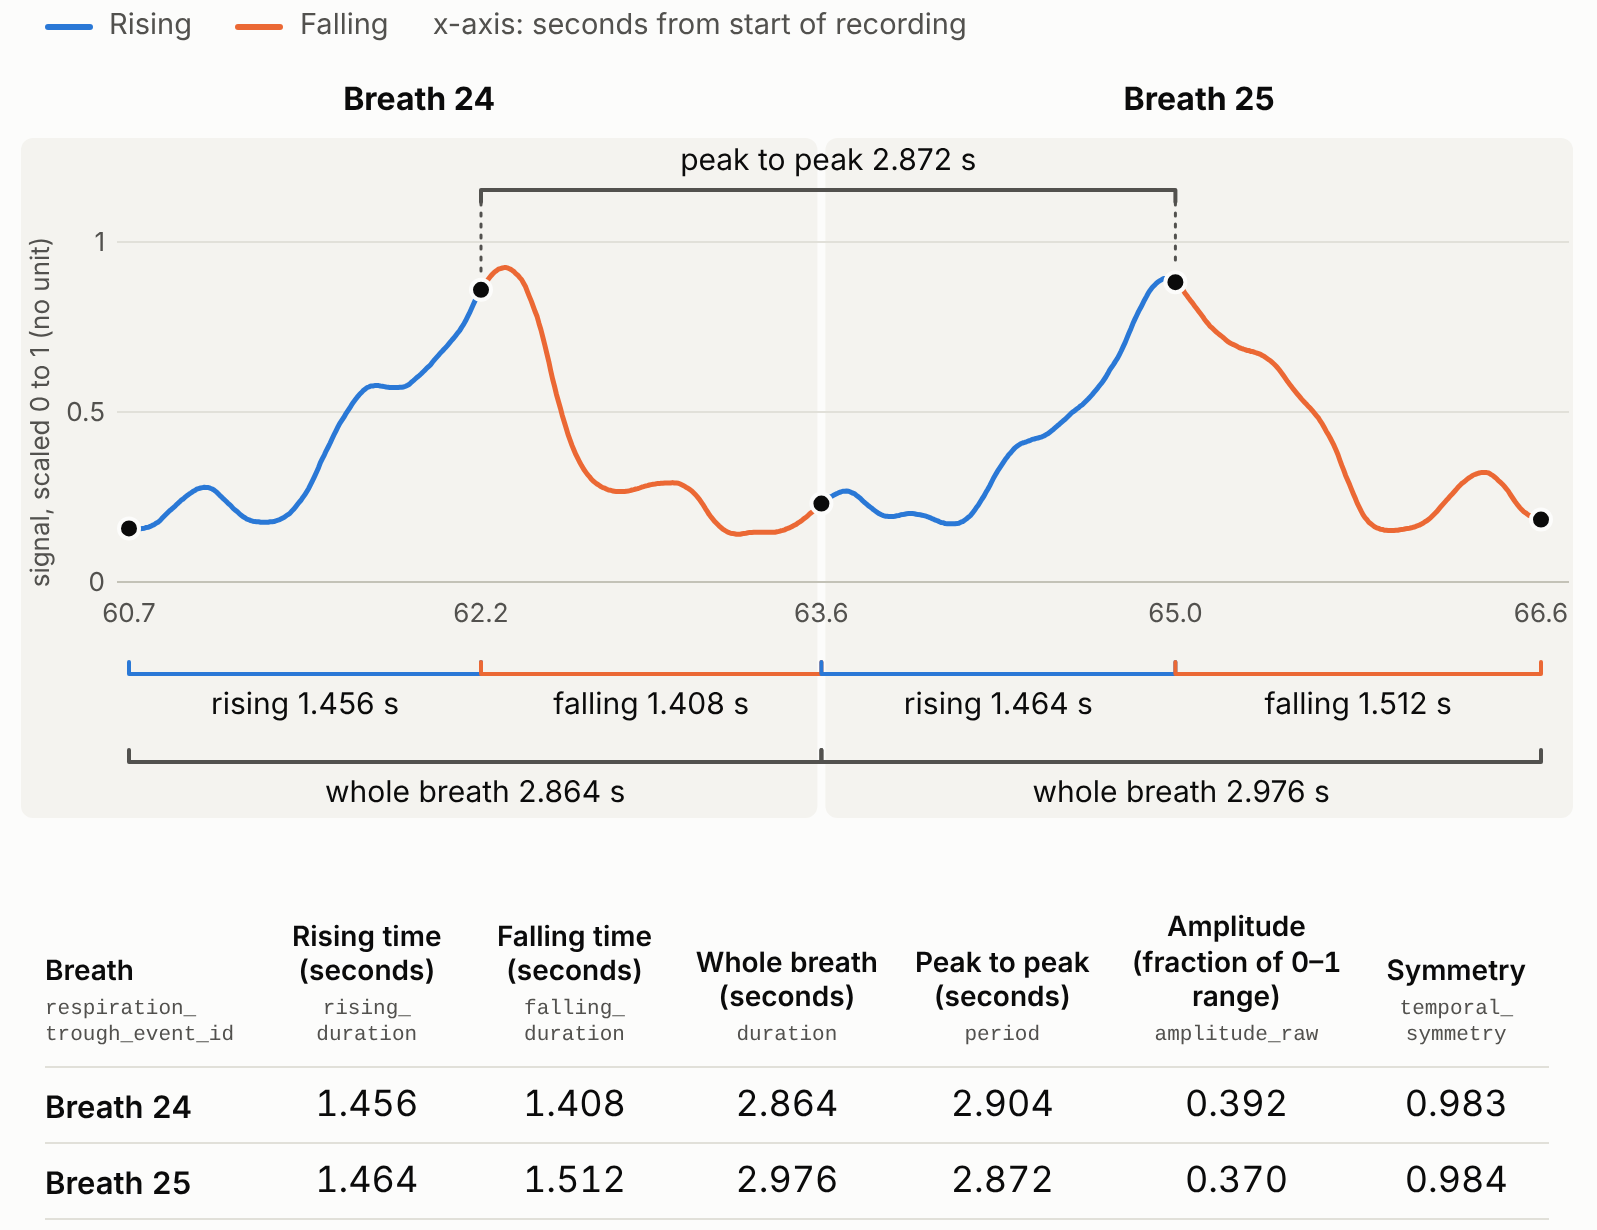
FeatureGraph takes a raw timeseries recording or data column and produces an object-level summary. An object is an identifiable event in a timeseries signal described by properties like its height, duration, and shape. The example below illustrates how a timeseries oscillation signal such as human breathing can be split into individual waves, each called an object.
The same object creation logic gets applied to other oscillatory behaviors like pressure changes in an industrial reactor or mechanical pulses from a rotating drill string. Object construction depends only on the shape of the signal and not on outside context, so the process is domain-agnostic and the accuracy of the derived properties can be traced directly back to the construction parameters, such as smoothing window sizes and detected periodicity of the wave.
Non-oscillatory signal behavior patterns are also in use as object construction templates, and objects other than individual waves can be created from oscillatory signals, but that is not discussed in this post.
BIDMC and CapnoBase are two public datasets of respiration recordings that measure breathing using different signals and sampling frequencies. FeatureGraph works in one-second intervals for both datasets, so the same measures can be computed on each.
Raw respiration data from a BIDMC recording gets converted to two breath objects. The accuracy of the objects is inspectable and verifiable at the point of construction.
Because the construction depends only on the shape of the signal and not on outside context, the results can be traced back to the construction parameters. Each summary is stored and can be queried through the data service.
A technical look into FeatureGraph
FeatureGraph has two parts: the compiler and the query layer. The compiler turns timeseries data into explicit objects, and the query layer allows the objects to be delivered in an analysis.
The compiler: P/D/O/M/S
Every object FeatureGraph produces moves through five layers. The first four layers of the compiler are built, fully deterministic, and run completely outside any language model. The fifth layer is being built to work with both human queries and agent-driven loops.
P - primitive. A built-in compiler operation trusted by construction. Example: identifying the rising or falling state in an oscillation, or calculating how much a physical quantity has exceeded a threshold over time.
D - definition. A parameter or configuration chosen by the user or supplied from outside the compiler, such as window size.
O - object. The compiled output of a definition, such as the amplitudes, periods, or durations of individual waves in a sample.
M - measure. A derived quantitative value computed from one or more objects, such as average duration or maximum temporal asymmetry.
S - scientific interpretation. This is the layer outside the scope of the deterministic compiler. It is a claim about what the measures mean, written by a person or agent.
The current version of FeatureGraph is built specifically for oscillatory scientific and engineering signals, but the platform can be adapted and customized to work with other types of timeseries data. FeatureGraph does not retain or store raw data within the service, and only the constructed objects are available to be queried.
The current compiler is featuregraph-core, installable with pip install featuregraph-core. More on the architecture: compiler paper.
Using FeatureGraph with language models for data access
FeatureGraph is building out the option to use natural-language data retrieval. A demo on a small mockup table uses an agent built on Cohere’s Command A. The values in the table are not derived from real data. Cycle count here refers to the number of breaths in a recording, and mean symmetry is the mean per-breath symmetry for the recording.
A user question is sent as written:
Among confident CapnoBase cases, which are outliers in BOTH the number of detected cycles and mean temporal symmetry? An outlier is a value at least 1.5 sample standard deviations from the mean of that measure across the confident cases in that dataset.
The agent itself writes the query, translating it from natural language, and a separate Python program outside the agent checks the query and runs it. It confirms that the query is well-formed, that the dataset it names exists in the table, and that it can run.
The query layer: ongoing development
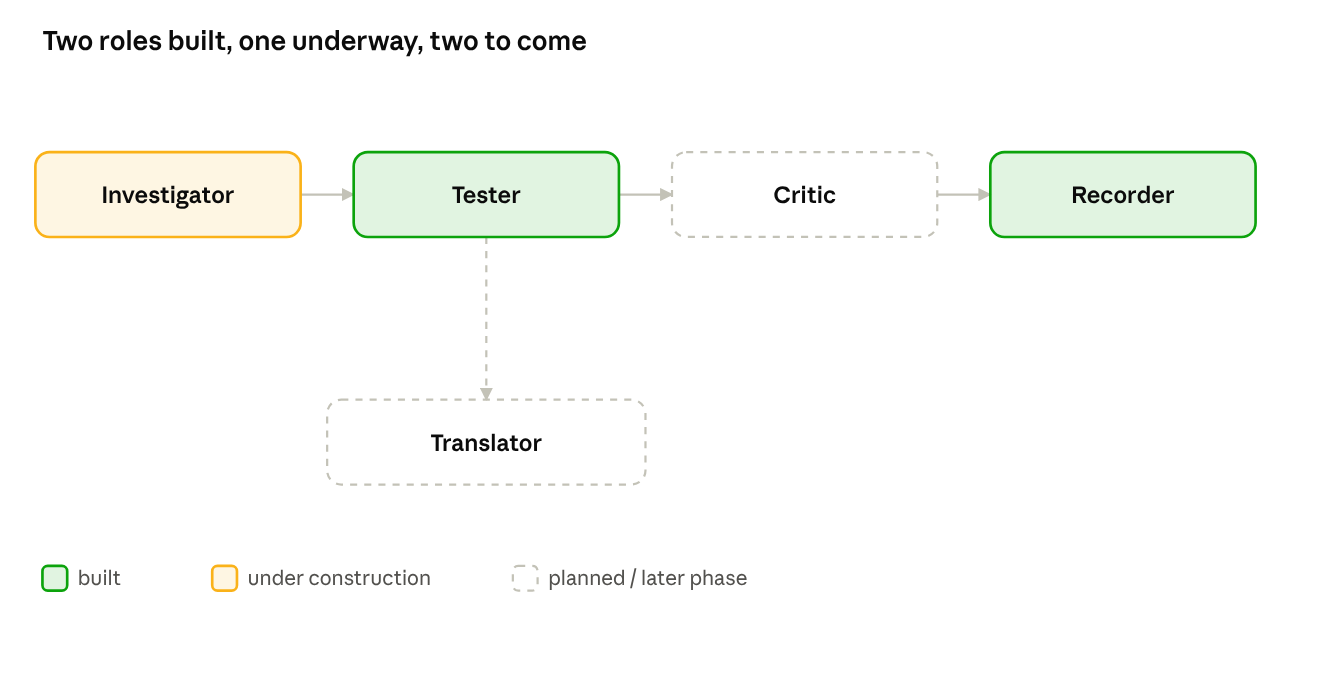
The scientific interpretation or query layer in FeatureGraph is composed of 5 agent types.
Investigator: proposes hypotheses as labeled free text. Nothing becomes a finding until tested. It can be replaced by human-authored queries.
Tester: writes specs that run through an outside deterministic program called the executor, checked by validation and held-out data. This is the agent type built for the Command A demo linked above.
Critic: judges whether a stated finding follows from what was actually run.
Recorder: writes the provenance record from run logs.
Translator: maps a new domain’s vocabulary onto the schema. This role is deferred until a later release. For now, each domain’s choices are made by hand and recorded.
Two agent types are built, with one in progress and two planned.
The developing stage is an agent loop that generates hypotheses and translates queries inside the language model, while the analysis itself runs outside it. This has two potential benefits:
The entire analysis can be tracked with receipts, rerun outside the loop, and checked for accuracy,
The loop can potentially be run on a more cost-efficient model than the frontier-size models that currently do open-ended research and hypothesis testing.
The output is a short, usually 2-3 page analysis stub that a human researcher can pick up, verify, and continue to build on. The existing research record can be found here.
Nazia Habib is a research engineer and data scientist building FeatureGraph, a framework for generative scientific data analysis using cost-effective language models. She specializes in the verification and behavioral compliance of automated systems.